Results Sheet Interpretation

Body Composition Analysis Muscle Fat Analysis Calculated Analysis Segmental Lean Analysis Body Water Analysis Body Composition History InBody Score Weight Control Body Balance Evaluation Segmental Fat Analysis Segmental Circumference Visceral Fat Level Research Parameters Impedance

Click an output on the Result Sheet
to see its interpretation.

Body Composition Analysis

The InBody 570 measures and analyses your body composition in terms of water, fat, protein, muscle and much more. The device can determine the weight of lean muscle tissue in each limb, the amount and percentage of body fat, bone mineral content, as well as a host of other valuable information.

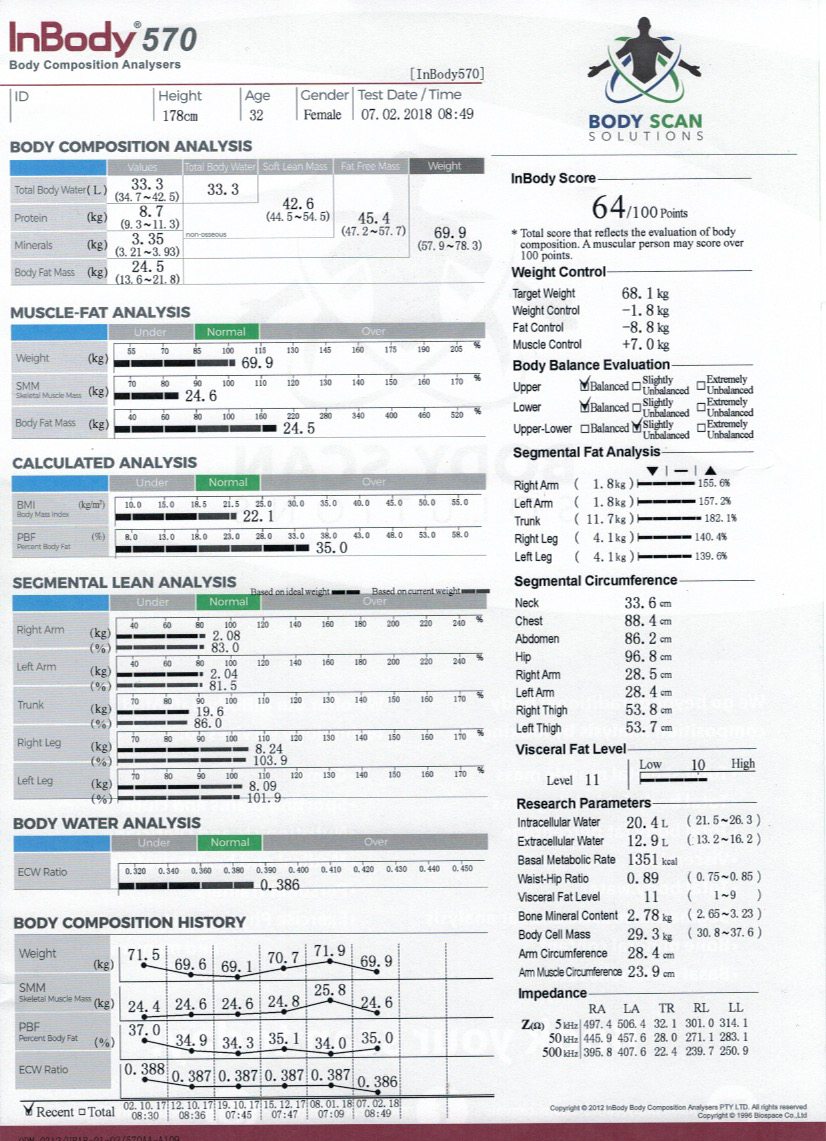
Total Body Water (TBW): TBW is all the water in the body and is approximately 60% of your total weight. Ideally your TBW should be in the normal range according to the table.

Protein: The protein measurement reflects the amount of nitrogen in the cells. Protein consists of nitrogen and high nitrogen levels within the cells indicate good levels of muscle mass and health. A lack of protein implies a lack of muscle mass possibly indicating poor nutrition and malnourishment. Protein is directly related to intracellular water, which in turn suggests poor nutrition. Ideally your protein content should be within (or exceed) the normal range set out within the table.

Minerals: The InBody 570 analyses two groups of minerals: osseous minerals and non-osseous minerals. Osseous mineral is bone mineral where non-osseous minerals are those found in all other parts of the body. Mineral mass is closely related to soft lean mass. If you have more lean mass, the weight increases bone strength, which in turn increases the bone mineral.

Body Fat Mass: Body fat mass is found under the skin or around organs. It is shown as the amount of fat the body has in kilograms. When a person’s fat mass is higher than the standard range, he/she is diagnosed as being obese. Monitoring the amount of body fat mass an individual has is critical to their health.

Muscle Fat Analysis

Muscle-Fat Analysis uses bar graphs to provide a comparison between weight, skeletal muscle mass, and body fat mass. The lengths of the bar graphs indicate the relationship between the current weight to the average value for that specific segment, based on your height. Therefore, an individual with a score of 100% is the average weight for their height.

Weight: The horizontal bar graph shows your current body weight in relation to the average weight for your height. The numbers next to the bar graphs indicate your body weight.

Skeletal Muscle Mass: Skeletal Muscle Mass (kg) displays how much muscle mass is attached to your bones. The bone consists of cardiac muscle, visceral muscle and skeletal muscle. However, skeletal muscle can be the most transformed through exercise/ diet, and is as such displayed separately. An individual with 100% skeletal muscle mass (SMM) has the average amount of muscle for someone their height. The normal range for SMM is 9-10%.

Body Fat Mass: Body fat mass represents all the fat molecules you have in your body and is represented in kilograms.

Calculated Analysis

Body Mass Index (BMI): BMI is an individual’s body mass divided by the square of their height. Although BMI is a widely used method to measure body mass, it does not take into consideration overall body composition and is inherently flawed. For example, a person with large amounts of muscle mass would be classified as overweight or highly unbalanced when using the BMI measurement.

Percent Body Fat (PBF): The InBody 570 can determine your body fat percentage. The American College of Sports Medicine suggests a PBF of 10-20% for men and 18-28% for women, is recommended for good health. It is important to comprehend that the percentage of body fat is the ratio of body fat relevant to total weight, not just muscle. Therefore, if the total weight increases (e.g. water or muscle mass, exclusively) then the percentage of body fat will change, however your actual body fat amount has not changed. This is the reason why the results fall under the calculated analysis. To be precise, we suggest you should always refer to the amount of body fat in kilograms, as this is a true indicator of total body fat and is much more important to monitor for changes.

Segmental Lean Analysis

The graph shows segmental muscle mass in each segment of your body (4 limbs and trunk) as well as the ideal ratio for each. By measuring the segmental muscle distribution, you can review your body balance and development level. InBody 570 provides information essential to check the possibility of the effectiveness of rehabilitation treatment or establish a direction for exercise.


The data is displayed as a double bar graph. The number at the end of the upper bar graph is the amount of the soft lean mass in kilograms. The lower bar shows your soft lean mass as a percentage, in relation to your actual weight. If the lower bar graph reaches 100%, it means you have ideal soft lean mass for your height.


Segmental lean analysis can be an effective tool to determine imbalances between each correlating body part. Ideally, you want to be within 6% of the correlating left or right limb, with any reading above 6% suggesting a reflection of muscular imbalances, which can be addressed through exercise. If you have issues with swelling of the cell (edema), this may affect your results and should be taken into consideration as part of the overall evaluation.

Body Water Analysis

The ratio of Extracellular Water (ECW) to Total Body Water (TBW) is an important indicator as to whether the body water is balanced. When in a healthy state, your ECW ratio should be in a range of 0.36 – 0.39. If the ECW ratio is above the range, it may be suggestive of edema (swelling of the cell) and may require you to seek further health care professional intervention.

Body Composition History

After an InBody scan, if an ID is entered at the beginning of the test, your results are saved onto the device and can be recalled. Saved test results help track and monitor weight, muscle mass, PBF and, body fat mass. When measuring under the same ID, you can obtain your body composition results from the last 8 scans. These will be displayed on the bottom of the result sheet in a cumulative graph. 

The cumulative graph quickly shows changes in your body composition and allows you to plan dietary/ exercise modifications.

InBody Score

The InBody score is a reflection of the overall evaluation of your body composition. The more muscle mass you have, the higher your score will be and as such a muscular person may score over 100 points.

Refer to the legend for comparison of your score:

69 or less Indicates the possibility of being out of balance (Muscle-Fat ratio) generally requiring nutrition and exercise intervention.
70 – 79 Generally, reflects the average person off the street who is reasonably balanced.
80 – 84 Generally, reflects those who actively look after their diet and exercise regimes.
85 + Generally found in well-trained individuals and is usually indicative of a well-balanced body.

Weight Control

In this section the InBody 570 gives suggestions on muscle and fat mass control.

Target Weight: Offers a suggestion on what your target weight should be.

Weight Control: Suggests how many kilograms to increase or decrease by.

Fat Control: Suggests how much fat to increase or decrease for optimal balance/ health.

Muscle Control: Suggests how much muscle to increase for optimal balance/ health.

Body Balance Evaluation

Body balance evaluation looks at the balance between the upper limbs, the lower limbs and the upper/ lower body parts in comparison to each other. If there is an imbalance, we recommend making changes to your exercise program to increase muscle mass of the smaller limbs as shown in the segmental lean analysis chart.

Segmental Fat Analysis

Segmental Fat Analysis is a means of assessing the distribution of fat around your body. It provides a way of determining predominant areas of fat located in the body.

The percentages indicate your fat mass in relation to their ideal percentage for their weight (100%). Less than 100% indicates a leaner fat mass in that area. Higher than 100% indicates a higher fat mass.

Segmental Circumference

Segmental circumference is the individual measurement of separate body parts. This is a useful measurement for those who are accustomed to traditional girth measurements and provides another means of assessing body part change.

Visceral Fat Level

VFL is an indicator based on the amount of fat surrounding internal organs in the abdomen. This is important to note, because if your visceral fat is high then there is a greater possible risk to your overall health.

Ideally it would be suggested to maintain a visceral fat under 10 to stay in the balanced range.

Research Parameters

Intracellular Water (ICW): ICW is water in the cells (Muscles are cells, so high muscle mass = high cells = high intracellular water). Ideally your ICW should be in the normal range or above.

Extracellular Water (ECW): ECW is water outside the cells (e.g. under the skin). Ideally your ECW should be in the normal or above range. (ECW is normally high if intracellular water is high).

Basal Metabolic Rate (BMR): BMR is the minimum amount of energy required to sustain vital functions whilst at rest. An effective way to raise BMR is to increase muscle mass.

Waist-Hip Ratio (WHR): WHR is a good indicator of your internal fat distribution. The higher the number, the more uneven the distribution can become between the waist and hip.

Bone Mineral Content (BMC): BMC is used in clinical medicine as an indirect indicator of osteoporosis. A high mineral content generally indicates a higher bone density and strength.

Body Cell Mass (BCM): BCM is the sum of the cells containing intracellular water and protein found in the organs. The main role of this index is to help evaluate your nutritional state.

Arm circumference (AC): AC is the measurement of the left arm. The left arm is measured as the majority of the population are right handed.

Arm Muscle Circumference (AMC): AMC is the measurement of the arm minus the fat. Excessive fat in this area is suggestive of possible hormonal imbalances and therefore may need to be monitored over a period of time to ensure there are no further increases.

Impedance

InBody provides segmental impedance values at varying frequencies to obtain an accurate analysis of the body.